
File:Fig2 Sabol 2021 Floods .png

Size of this preview: 800 × 494 pixels. Other resolution: 2,438 × 1,504 pixels.
Original file (2,438 × 1,504 pixels, file size: 786 KB, MIME type: image/png)
Summary
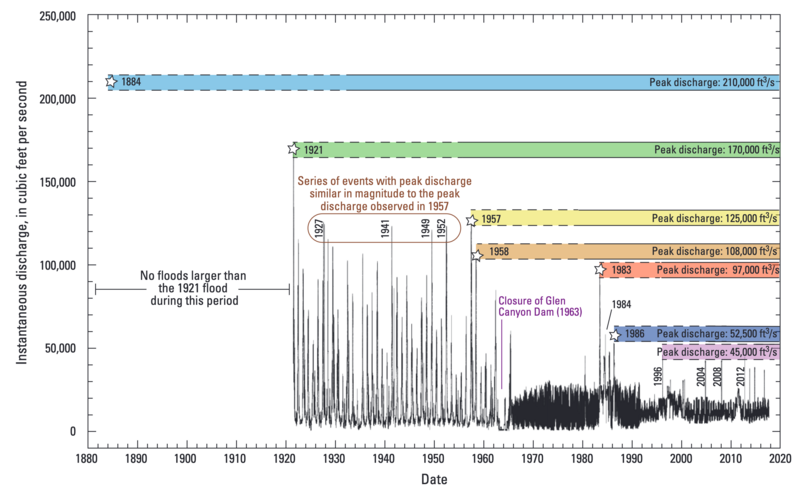
Plot showing gaged daily streamflow, Colorado River at Lees Ferry, Arizona (USGS gage 09380000), 1921-2018 (thin black line); 7 stars and colored bars highlight seven historical peak-flow events that correspond to the series of strandlines of flood debris within the Grand Canyon.(Source: Figure 2 in Sabol et al. 2021)
File history
Click on a date/time to view the file as it appeared at that time.
| Date/Time | Thumbnail | Dimensions | User | Comment | |
|---|---|---|---|---|---|
| current | 17:51, 16 November 2023 | | 2,438 × 1,504 (786 KB) | JeffreyJLukas (talk | contribs) | Plot showing gaged daily streamflow, Colorado River at Lees Ferry, Arizona (USGS gage 09380000), 1921-2018 (thin black line); 7 stars and colored bars highlight seven historical peak-flow events that correspond to the series of strandlines of flood debris within the Grand Canyon.(Source: Figure 2 in Sabol et al. 2021) |
You cannot overwrite this file.
File usage
The following page uses this file:
