
File:Southwest JJA Tmax figure.png
Size of this preview: 800 × 394 pixels. Other resolution: 1,777 × 876 pixels.
Original file (1,777 × 876 pixels, file size: 296 KB, MIME type: image/png)
Summary
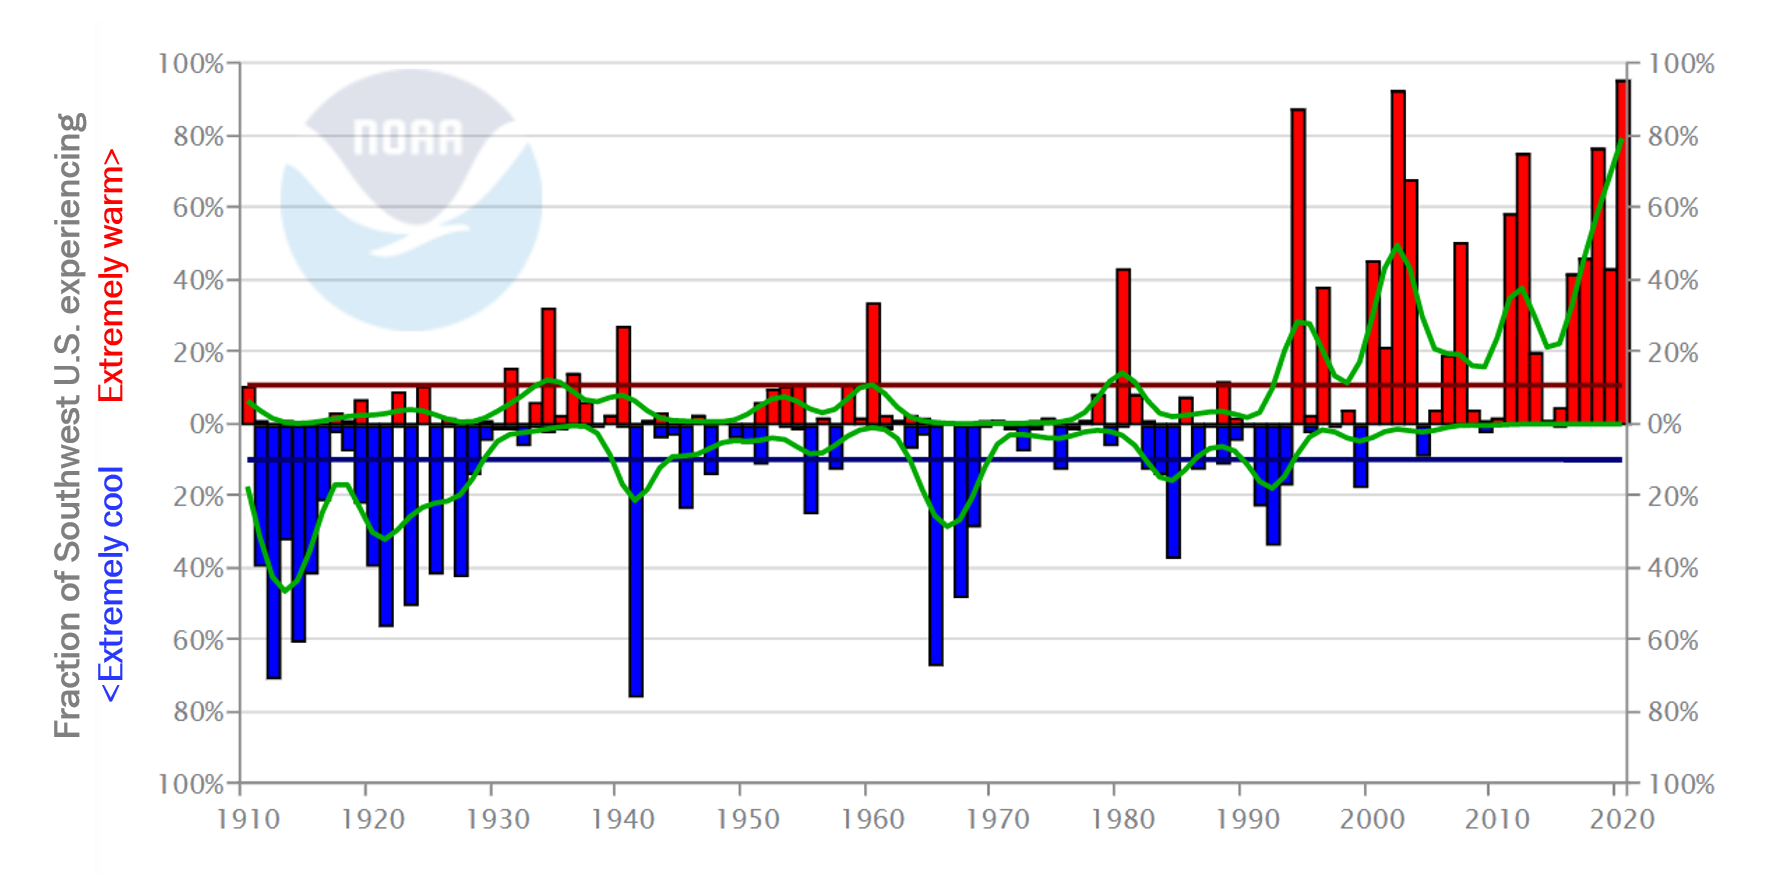
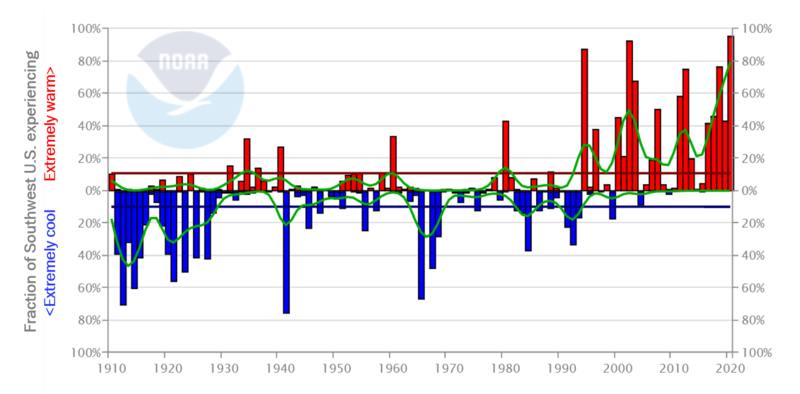
Time-series chart showing the proportion of the Southwest U.S. covered by extremely warm or extremely cool summer daily high temperatures, 1895 to 2020.
File history
Click on a date/time to view the file as it appeared at that time.
| Date/Time | Thumbnail | Dimensions | User | Comment | |
|---|---|---|---|---|---|
| current | 13:37, 10 May 2021 | | 1,777 × 876 (296 KB) | JeffreyJLukas (talk | contribs) | Time-series chart showing the proportion of the Southwest U.S. covered by extremely warm or extremely cool summer daily high temperatures, 1895 to 2020. |
You cannot overwrite this file.
File usage
There are no pages that use this file.
